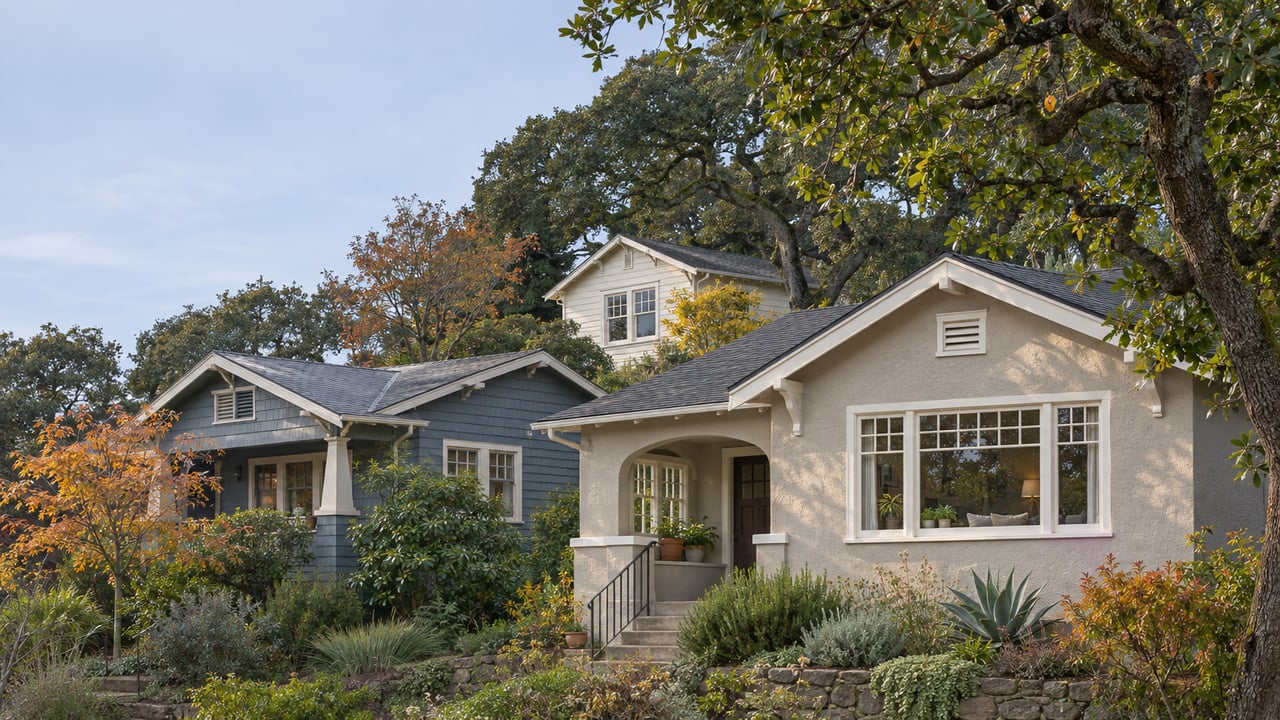
What an Oakland List Price Tells You, and What It Doesn't
November 19, 2026
November 19, 2026
In May 2026, the San Francisco Chronicle reported that typical Oakland home values were 28% below their March 2019 level. Five months later, buyers of detached houses in the Oakland area paid an average of 123% of list price in October 2026, according to the Bay East Association of Realtors' October 2026 Oakland report. In that same report, the average October list price was $1,054,036 and the average sale price was $1,338,567.
In Oakland, the list price on a house is usually set to bring in buyers and start the bidding, not to estimate what the house is worth. That is how values below their 2019 level and bids far over asking can come out of the same market. If you're comparing Oakland with Hayward, Fremont or Dublin, translate that number first.
East Bay agents have priced houses this way for years. In 2017, Berkeleyside described the strategy as setting the asking price roughly 20% below the expected sale price, with the seller counting on multiple offers rather than a deal at list. The same reporting explained the search-filter logic behind it. A buyer who can spend $1 million might cap a search at $799,000 because they expect to bid above asking, so a lower list price puts the house in front of more people.
Oakland's hills had a well-known example that year. Berkeleyside reported that 1601 Mountain Blvd. was listed at $995,000 and sold for $1.65 million, $655,000 over asking. That article put the 2017 sale-to-list ratio at 111% in Oakland, 117% in Berkeley and 108% in San Francisco.
The practice has lasted. In April 2026, the Chronicle noted that the "price to entice" gap between sale and list prices has consistently been wider in East Bay cities like Berkeley and Oakland. In the same piece, an East Bay Realtor said the approach works so well for sellers that breaking from it usually hurts the sale price. "It's just become a cycle we haven't been able to change or break out of," she told the Chronicle.
So a 123% average says more about where Oakland sellers set their asking prices than about how fast prices are rising.
The best evidence that the overbid is a pricing habit for houses comes from Oakland itself. Bay East's October 2026 report for Oakland condos and townhomes shows buyers paid 103% of list that month, with a $565,000 median, about 44 days on market and 3.6 months of supply. From October 2025 through October 2026, the condo and townhome ratio never went above 103% or below 97%.
That's the same city and the same months, under a different pricing convention. The Chronicle's May 2026 reporting points to one reason the condo side runs closer to list. An East Bay Realtor told the paper that renting is often cheaper than a condo mortgage plus association dues, which keeps some buyers out. She described Oakland as "several little micro-markets rather than one market." For you, that means an Oakland condo's list price is close to its likely sale price, and a house's list price usually isn't.
If the 123% were only a pricing habit, it would stay about the same all year. It doesn't. Bay East's monthly table for Oakland-area detached homes shows how far the ratio moved:
| Month | Sale price as % of list | Median sale price | Active listings |
|---|---|---|---|
| Oct 2025 | 113% | $1,025,000 | 501 |
| Dec 2025 | 109% | $875,000 | 224 |
| Jan 2026 | 103% | $705,000 | 289 |
| Mar 2026 | 120% | $1,155,000 | 360 |
| Jul 2026 | 115% | $905,000 | 352 |
| Sep 2026 | 120% | $962,000 | 370 |
| Oct 2026 | 123% | $1,105,000 | 356 |
Two patterns stand out. First, list and sale prices came closest together in winter: 109% in December 2025 and 103% in January 2026. Second, October 2026 had 356 active listings, against 501 in October 2025, while sales held about steady at 200 against 209. The median sale price rose 7.8% over the same October-to-October span. Fewer houses for sale with about the same number of buyers pushed this fall's ratio above last fall's. The pricing habit sets the baseline, and supply and demand move the ratio up or down from it.
The competition isn't spread evenly across the city either. In May 2026, the Chronicle reported that bidding wars were still common in Rockridge and Claremont. Typical values in the 94618 ZIP code, which includes Rockridge, fell only about 5% from March 2025 to March 2026, while the downtown 94612 ZIP code fell 16% from 2025 to 2026. Bay East's year-to-date sales show the same tilt toward the top of the market. Through October, 140 Oakland-area houses sold between $1.7 million and $1.999 million in 2026, compared with 81 in all of 2025, and 90 sold above $3 million, compared with 56. Sales under $500,000 fell to 178 from 231. One caveat: Bay East's Oakland geography includes Emeryville and Piedmont, and its data comes from the MLS.
Seen next to the cities buyers usually compare it with, Oakland is clearly one of the cities with a wide gap. Here are October 2026 figures for detached homes from Bay East's city reports:
| City | Sale price as % of list | Median sale price | Avg. days on market |
|---|---|---|---|
| Berkeley | 139% | $1,800,000 | 17 |
| Oakland | 123% | $1,105,000 | 25 |
| Alameda | 114% | $1,275,000 | 18 |
| San Leandro | 106% | $878,750 | 21 |
| Castro Valley | 105% | $1,290,000 | 32 |
| Fremont | 101% | $1,700,000 | 24 |
| Hayward | 100% | $950,000 | 27 |
| Dublin | 98% | $1,485,000 | 35 |
Hayward and Oakland can look similar on a listing site, with Hayward's average October list price at $1,099,875 and Oakland's at $1,054,036. Look at what sold, though. Hayward's average sale price was $1,100,994 and Oakland's was $1,338,567. Two houses with nearly the same asking price can end up more than $200,000 apart once the bidding is over.
Some rough math follows from October's average. If you can spend $1.1 million, an Oakland house listed around $895,000 sold, on average, for about that much. A Hayward house listed at $1.1 million sold for about $1.1 million. An average is not a forecast for any particular street, and the gap changes with the season, as the 103% January above shows. Still, if you set the same search ceiling in both cities, you'll be looking at different houses in each.
Is winter the time to buy in Oakland? Over the past year, the gap between list and sale prices was smallest in December 2025 and January 2026, at 109% and 103%. Inventory was also at its lowest then, with 224 active listings in December. A smaller gap means the list price is a closer guide to what you'll pay, but you'll have fewer houses to choose from.
Does a big overbid mean I overpaid? Not by itself. The overbid is measured against a number Oakland sellers usually set low on purpose. The better comparison is recent sale prices for similar houses nearby.
Does the same math work for Oakland condos and townhomes? No. Through October 2026, Oakland condos and townhomes sold between 97% and 103% of list every month for a full year. If you're weighing an attached home against a detached house in the city, take the condo's list price close to face value and translate the house's list price upward.
Dixit Properties is a broker-led brokerage based in Hayward, serving buyers across the East Bay, Oakland included. If you're deciding where to set your search ceiling, we'll go through recent sales of houses like the ones you're watching and help you turn their list prices into a realistic offer range. Request a free consultation and bring your saved listings.
He have built a vast array of clients in the Bay Area, whether it be a luxury estate client, first-time homebuyer, or seasoned investor. The driving principles include putting the clients' needs first, built on a foundation of hard work, trust, and integrity.